> ## Documentation Index
> Fetch the complete documentation index at: https://docs.bioptimus.com/llms.txt
> Use this file to discover all available pages before exploring further.
# M-Optimus
> A multimodal, multi-scale foundation model that predicts spatial gene expression from histology.
M-Optimus is a **multimodal, multi-scale** foundation model. The current generation, **M-Optimus-1 (M1)**, learns across three biological layers at once — H\&E pathology, bulk RNA-seq, and spatial transcriptomics — to build a unified representation of a patient across tissue and molecular scales.
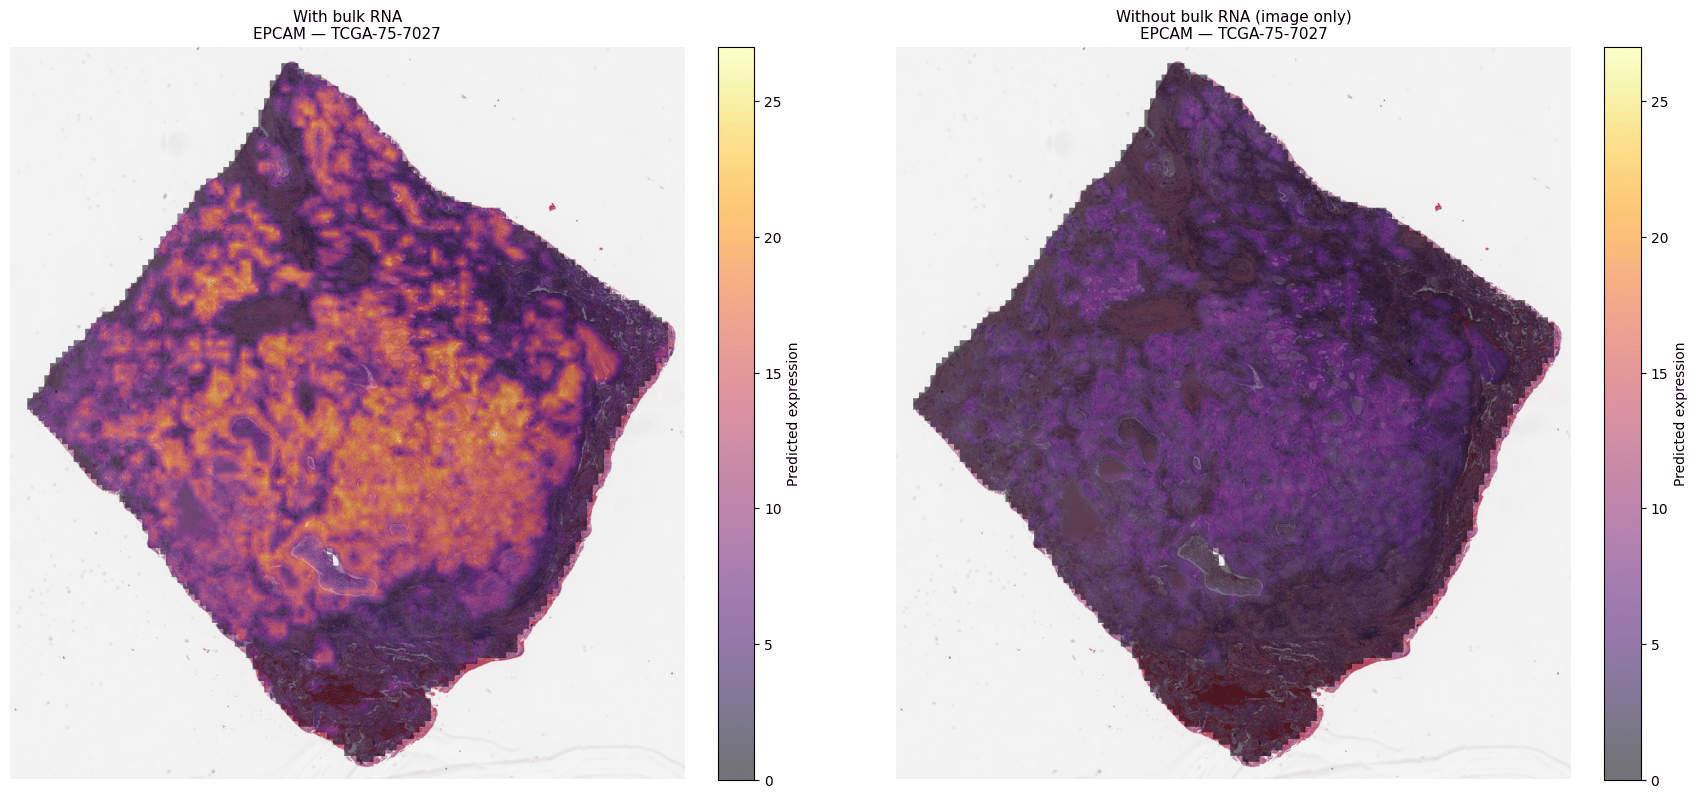
Its headline capability is **predicting spatial gene expression directly from a routine H\&E tile**, across up to 6,002 genes, optionally refined with bulk RNA-seq — recovering an expensive molecular readout from a low-cost slide. M-Optimus also produces the same 1536-d tile embeddings as [H-Optimus](/documentation/models/h-optimus). It is trained on proprietary multimodal cohorts, powered by the [STELA](https://www.bioptimus.com/stela) data engine.
## What makes it different
Where H-Optimus stops at features, M-Optimus adds a **prediction** head over a defined set of output genes. Provide a tile and (optionally) a bulk RNA vector, and it returns predicted expression per output gene — which you can render as spatial heatmaps. Because it is multimodal at both training and inference, it can ingest H\&E alone or H\&E + bulk RNA, with no retraining needed to benefit from the extra modality.
 ## Performance
Results below are from the [M-Optimus-1 report](https://www.bioptimus.com); rankings and metrics are task- and dataset-dependent.
| Result | Finding |
| ------------------------------------- | -------------------------------------------------------------------------------------------------------------------------------------- |
| Spatial gene expression from H\&E | **+60%** vs. DeepSpot, a leading H\&E→ST model (\~30% from proprietary pretraining data, \~30% from the multimodal method) |
| Adding bulk RNA at inference | **+4%** over H\&E-only, with no retraining (late-binding) |
| HEST (gene expression from histology) | **0.440** avg. Pearson vs. **0.423** for H-Optimus-1 |
| Classification (mean AUC, 9 tasks) | **0.664** vs. **0.661** for H-Optimus-1 — matches the image-only SOTA while adding molecular prediction |
| Generalist vs. specialists | **+8%** on colon and head & neck vs. indication-specific models; strong zero-shot generalization to unseen tissues (e.g. kidney, skin) |
## Modes
* **Endpoint:** `POST /api/predict/m-optimus`
* **Input:** 224×224 tile at 0.5 µm/px, plus optional `bulk_rna` aligned to the model's input gene set. Omitting bulk RNA uses a zero vector (H\&E-only mode).
* **Output:** predicted expression for each output gene.
* Gene sets are available at `GET /api/metadata/m-optimus`.
* **Endpoint:** `POST /api/embed/m-optimus`
* **Input:** 224×224 tile at 0.5 µm/px.
* **Output:** 1536-d tile feature vector.
The [SDK](/guides/get-started/sdk) aligns and reorders your bulk RNA to the model's input gene set automatically. See [Add bulk RNA](/guides/workflows/spatial-transcriptomics#3-add-bulk-rna-multimodal-prediction) for the full input contract and transform pipeline.
## Specifications
| Property | Value |
| -------------------- | --------------------------------------------------------------------------- |
| Tasks | Spatial gene-expression prediction (spot-level); tile embedding |
| Genes | Up to 6,002 (model's defined output set; see `GET /api/metadata/m-optimus`) |
| Input | 224×224 RGB tile at 0.5 µm/px (+ optional bulk RNA) |
| Bulk RNA input | TPM-normalized expression values, Ensembl gene IDs |
| Bulk RNA transforms | Server-side: `log1p` on input, `expm1` on output |
| Embedding | 1536-d |
| SageMaker dispatch | `model_name: "m-optimus"` |
| Recommended instance | `ml.g5.xlarge` |
## What you can build
M-Optimus turns routine slides into a molecular map for translational research:
Surface candidate biomarkers and molecular signatures from H\&E at scale.
Enrich and stratify cohorts; analyze legacy trial slides retrospectively.
## Access & deploy
M-Optimus is available now by request. [Contact Bioptimus](https://www.bioptimus.com/contact) to discuss access, then deploy on AWS SageMaker or on-premise — see the [Deployment overview](/deployment/overview) for setup steps.
M-Optimus is not available on Hugging Face. For academic-only H\&E feature extraction, use [H-Optimus on Hugging Face](/deployment/platforms/hugging-face).
## Guides
Predict spatial gene expression end to end.
Run a model over many slides.
## Performance
Results below are from the [M-Optimus-1 report](https://www.bioptimus.com); rankings and metrics are task- and dataset-dependent.
| Result | Finding |
| ------------------------------------- | -------------------------------------------------------------------------------------------------------------------------------------- |
| Spatial gene expression from H\&E | **+60%** vs. DeepSpot, a leading H\&E→ST model (\~30% from proprietary pretraining data, \~30% from the multimodal method) |
| Adding bulk RNA at inference | **+4%** over H\&E-only, with no retraining (late-binding) |
| HEST (gene expression from histology) | **0.440** avg. Pearson vs. **0.423** for H-Optimus-1 |
| Classification (mean AUC, 9 tasks) | **0.664** vs. **0.661** for H-Optimus-1 — matches the image-only SOTA while adding molecular prediction |
| Generalist vs. specialists | **+8%** on colon and head & neck vs. indication-specific models; strong zero-shot generalization to unseen tissues (e.g. kidney, skin) |
## Modes
* **Endpoint:** `POST /api/predict/m-optimus`
* **Input:** 224×224 tile at 0.5 µm/px, plus optional `bulk_rna` aligned to the model's input gene set. Omitting bulk RNA uses a zero vector (H\&E-only mode).
* **Output:** predicted expression for each output gene.
* Gene sets are available at `GET /api/metadata/m-optimus`.
* **Endpoint:** `POST /api/embed/m-optimus`
* **Input:** 224×224 tile at 0.5 µm/px.
* **Output:** 1536-d tile feature vector.
The [SDK](/guides/get-started/sdk) aligns and reorders your bulk RNA to the model's input gene set automatically. See [Add bulk RNA](/guides/workflows/spatial-transcriptomics#3-add-bulk-rna-multimodal-prediction) for the full input contract and transform pipeline.
## Specifications
| Property | Value |
| -------------------- | --------------------------------------------------------------------------- |
| Tasks | Spatial gene-expression prediction (spot-level); tile embedding |
| Genes | Up to 6,002 (model's defined output set; see `GET /api/metadata/m-optimus`) |
| Input | 224×224 RGB tile at 0.5 µm/px (+ optional bulk RNA) |
| Bulk RNA input | TPM-normalized expression values, Ensembl gene IDs |
| Bulk RNA transforms | Server-side: `log1p` on input, `expm1` on output |
| Embedding | 1536-d |
| SageMaker dispatch | `model_name: "m-optimus"` |
| Recommended instance | `ml.g5.xlarge` |
## What you can build
M-Optimus turns routine slides into a molecular map for translational research:
Surface candidate biomarkers and molecular signatures from H\&E at scale.
Enrich and stratify cohorts; analyze legacy trial slides retrospectively.
## Access & deploy
M-Optimus is available now by request. [Contact Bioptimus](https://www.bioptimus.com/contact) to discuss access, then deploy on AWS SageMaker or on-premise — see the [Deployment overview](/deployment/overview) for setup steps.
M-Optimus is not available on Hugging Face. For academic-only H\&E feature extraction, use [H-Optimus on Hugging Face](/deployment/platforms/hugging-face).
## Guides
Predict spatial gene expression end to end.
Run a model over many slides.