> ## Documentation Index
> Fetch the complete documentation index at: https://docs.bioptimus.com/llms.txt
> Use this file to discover all available pages before exploring further.
# Visualizing results
> Load Zarr/HDF5/NPZ outputs and overlay gene expression or tissue masks.
Inference outputs are written as Zarr (default), HDF5, or NPZ — all three carry the same datasets under the same keys.
Figures in this documentation are real model outputs on open-access **TCGA** slides (e.g. `TCGA-75-7027`), shown as representative examples — not benchmarks. See [Responsible use → Data attribution](/documentation/resources/responsible-use#data-attribution).
## Load an output file
Load a Zarr output with the built-in helper; it returns the arrays and metadata as a dict.
```python theme={null}
from bioptimus import utils
data = utils.load_zarr_output(result_path)
preds, coords = data["outputs"], data["coords"]
gene_names = data.get("gene_names") # M-Optimus gene predictions only; None for embeddings
```
`load_zarr_output` returns the following datasets (plus a `metadata` dict). Optional entries are present only when the model and pipeline produce them:
| Key | Shape | Description |
| --------------- | -------------- | ------------------------------------------------------------------------------------ |
| `outputs` | `(n_tiles, D)` | Per-tile embeddings (`D` = 1536) or gene predictions (`D` = number of output genes). |
| `coords` | `(n_tiles, 2)` | Pixel `(x, y)` location of each tile on the slide. |
| `gene_names` | `(D,)` | Output gene identifiers (M-Optimus only). |
| `thumbnail` | `(H, W, 3)` | Downsampled RGB slide overview. |
| `tissue_mask` | `(H, W)` | Boolean tissue-vs-background mask. |
| `tissue_ratios` | `(n_tiles,)` | Fraction of each tile covered by tissue. |
Metadata attributes include `slide_dimensions`, `slide_dimensions_at_mpp`, `tile_size`, `mpp`, and `num_tiles`. HDF5 (`.h5`) and NPZ (`.npz`) outputs expose the same keys via `h5py` and `np.load(allow_pickle=True)`.
## Plot with the built-in helpers
The helpers below visualize **M-Optimus gene predictions** and require the `gene_names` returned above. For H-Optimus tile embeddings (no `gene_names`), see [Tile embeddings & PCA](/guides/workflows/embeddings-pca).
`bioptimus.utils` ships the plotting helpers used in the [getting-started notebooks](https://github.com/bioptimus/m-jumpstart). Heatmap overlays and single-gene overlays are all covered by the [spatial gene panel](#spatial-gene-panel) helper below — pass a single-entry `GENE_PANEL` for one gene — so there's no need to hand-roll matplotlib.
### Spatial gene panel
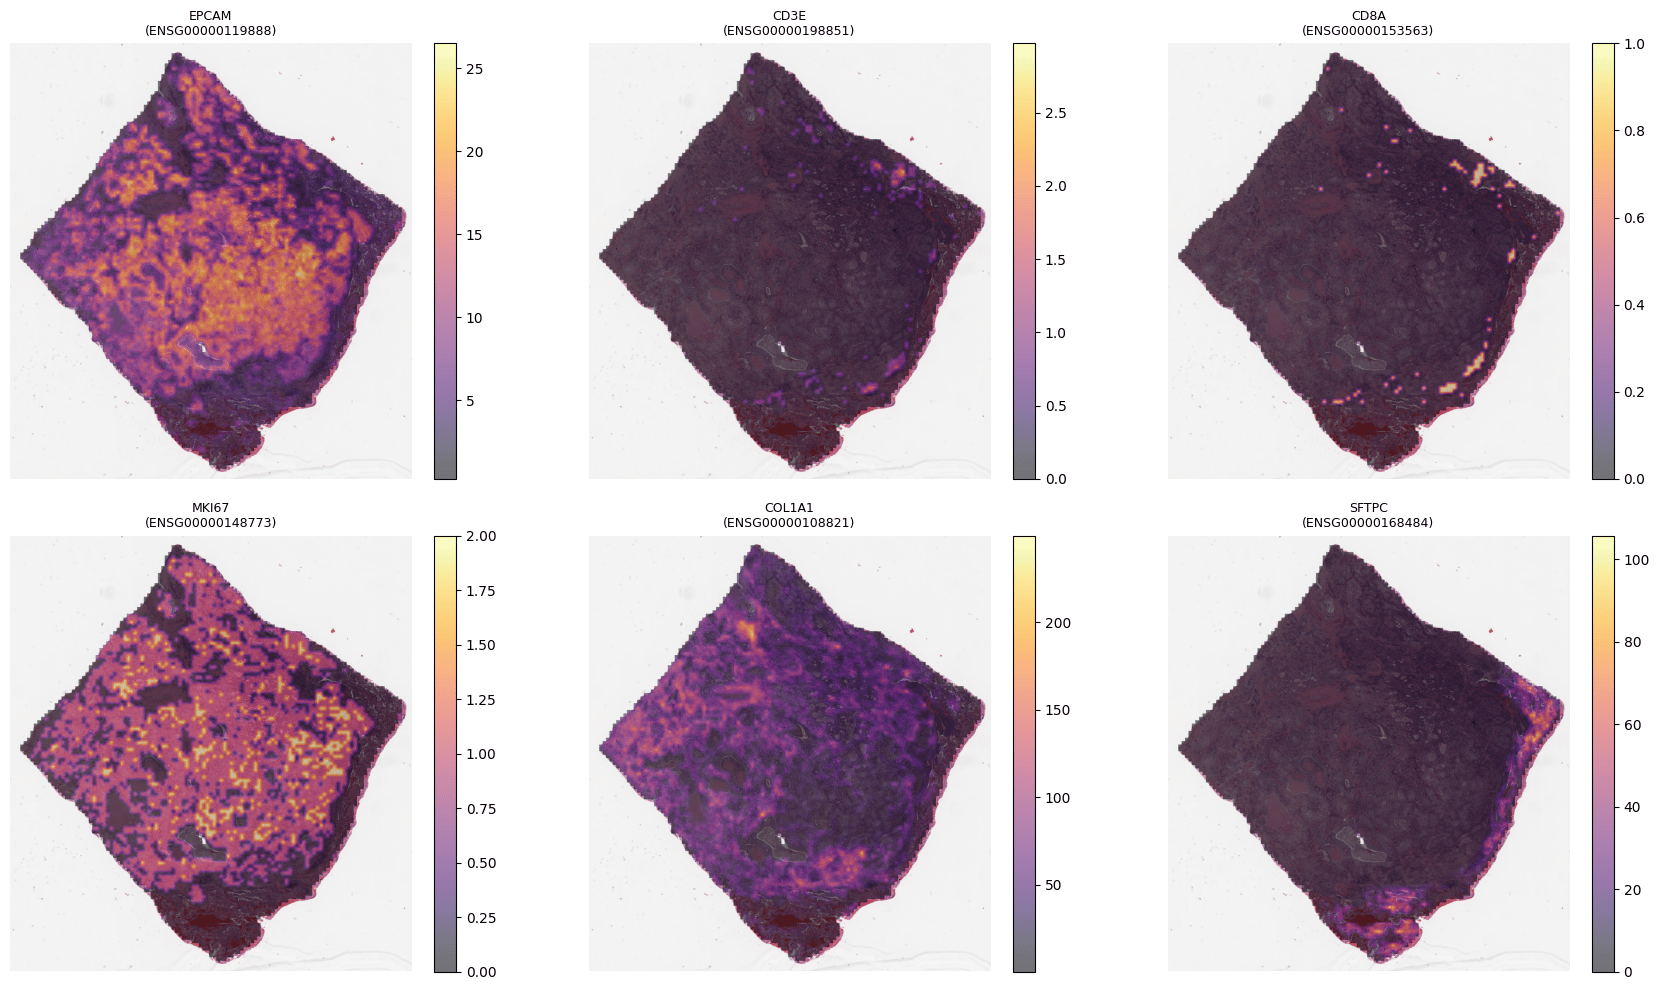
Overlay one or more genes on the slide thumbnail in one call.
```python theme={null}
GENE_PANEL = {
"EPCAM": "ENSG00000119888", # epithelium / tumor
"CD3E": "ENSG00000198851", # T-cells
"CD8A": "ENSG00000153563", # cytotoxic T-cells
"MKI67": "ENSG00000148773", # proliferation
"COL1A1": "ENSG00000108821", # stroma
"SFTPC": "ENSG00000168484", # alveolar (lung)
}
utils.plot_gene_panel_overlay(preds, coords, gene_names, GENE_PANEL,
wsi_path=wsi_path, cols=3, cmap="inferno")
```
 ### Image-only vs. bulk-RNA-guided
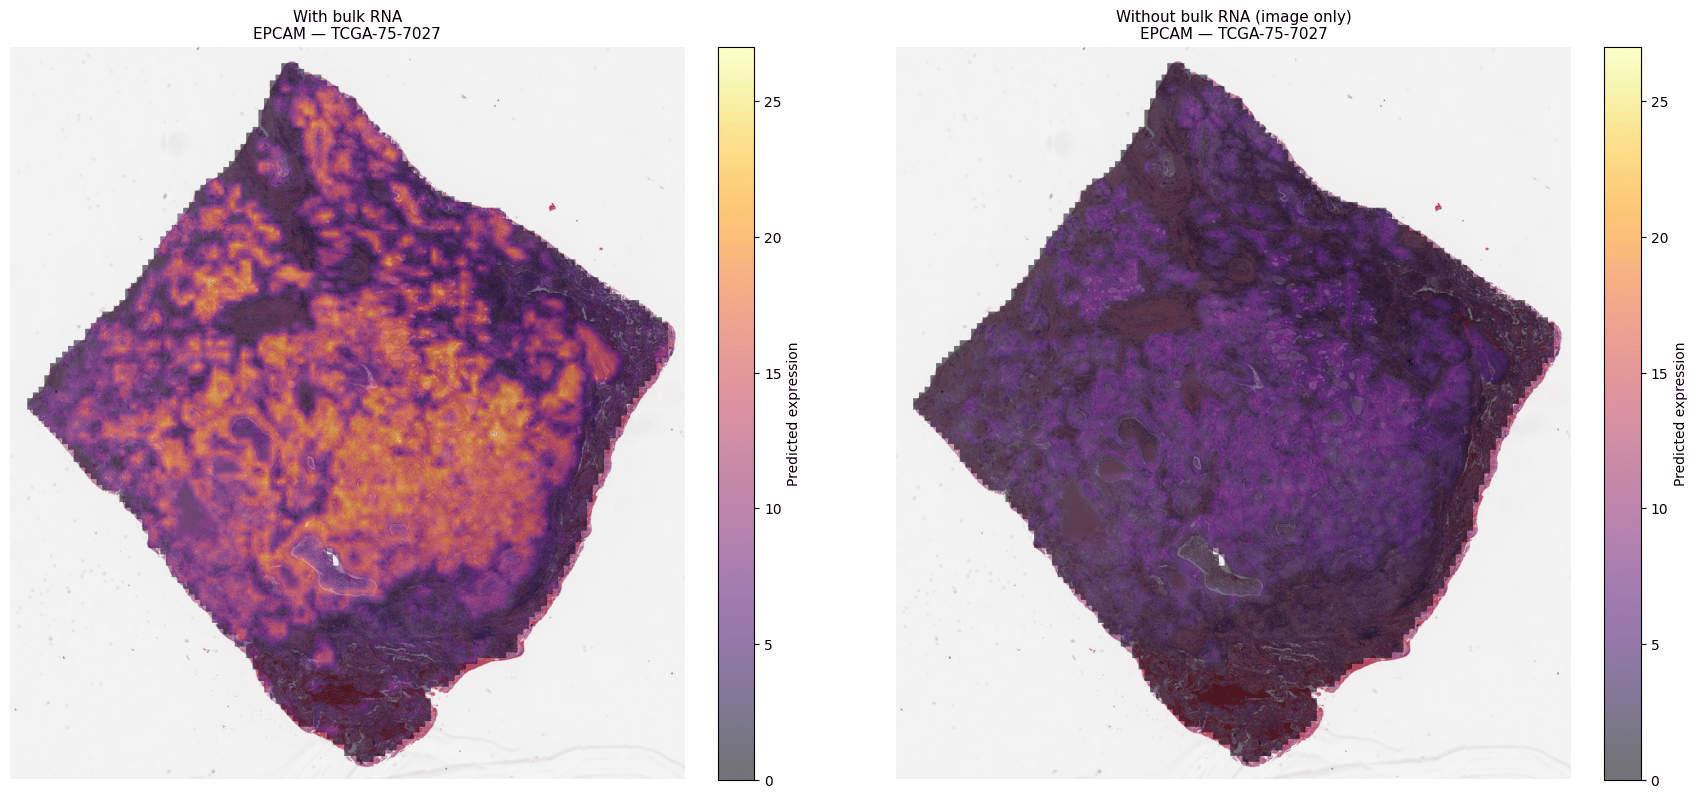
Compare the same gene predicted with and without bulk RNA context.
```python theme={null}
gene_idx = gene_names.index("ENSG00000119888") # EPCAM
utils.plot_gene_overlay_comparison(
preds_bulk, coords_bulk, preds_image_only, coords_image_only,
gene_idx=gene_idx, wsi_path=wsi_path, gene_name="EPCAM",
label_a="With bulk RNA", label_b="Without bulk RNA (image only)",
)
```
### Image-only vs. bulk-RNA-guided
Compare the same gene predicted with and without bulk RNA context.
```python theme={null}
gene_idx = gene_names.index("ENSG00000119888") # EPCAM
utils.plot_gene_overlay_comparison(
preds_bulk, coords_bulk, preds_image_only, coords_image_only,
gene_idx=gene_idx, wsi_path=wsi_path, gene_name="EPCAM",
label_a="With bulk RNA", label_b="Without bulk RNA (image only)",
)
```
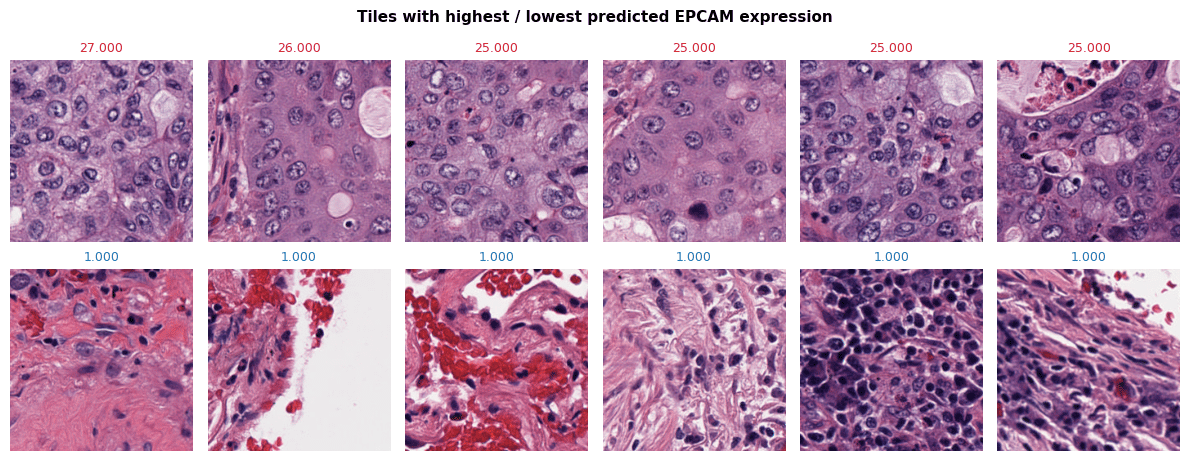
 ### Highest- and lowest-expressing tiles
Pull the tiles driving a gene's prediction for quick visual QC.
```python theme={null}
utils.plot_top_gene_tiles(preds, coords, gene_idx=gene_idx,
wsi_path=wsi_path, gene_name="EPCAM",
n_top=6, n_bottom=6)
```
### Highest- and lowest-expressing tiles
Pull the tiles driving a gene's prediction for quick visual QC.
```python theme={null}
utils.plot_top_gene_tiles(preds, coords, gene_idx=gene_idx,
wsi_path=wsi_path, gene_name="EPCAM",
n_top=6, n_bottom=6)
```