

Figures in this documentation are real model outputs on open-access TCGA slides (e.g.
TCGA-75-7027), shown as representative examples — not benchmarks. See Responsible use → Data attribution.Load an output file
Load a Zarr output with the built-in helper; it returns the arrays and metadata as a dict.load_zarr_output returns the following datasets (plus a metadata dict). Optional entries are present only when the model and pipeline produce them:
Metadata attributes include
slide_dimensions, slide_dimensions_at_mpp, tile_size, mpp, and num_tiles. HDF5 (.h5) and NPZ (.npz) outputs expose the same keys via h5py and np.load(allow_pickle=True).
Plot with the built-in helpers
The helpers below visualize M-Optimus gene predictions and require the
gene_names returned above. For H-Optimus tile embeddings (no gene_names), see Tile embeddings & PCA.bioptimus.utils ships the plotting helpers used in the getting-started notebooks. Heatmap overlays and single-gene overlays are all covered by the spatial gene panel helper below — pass a single-entry GENE_PANEL for one gene — so there’s no need to hand-roll matplotlib.
Spatial gene panel
Overlay one or more genes on the slide thumbnail in one call.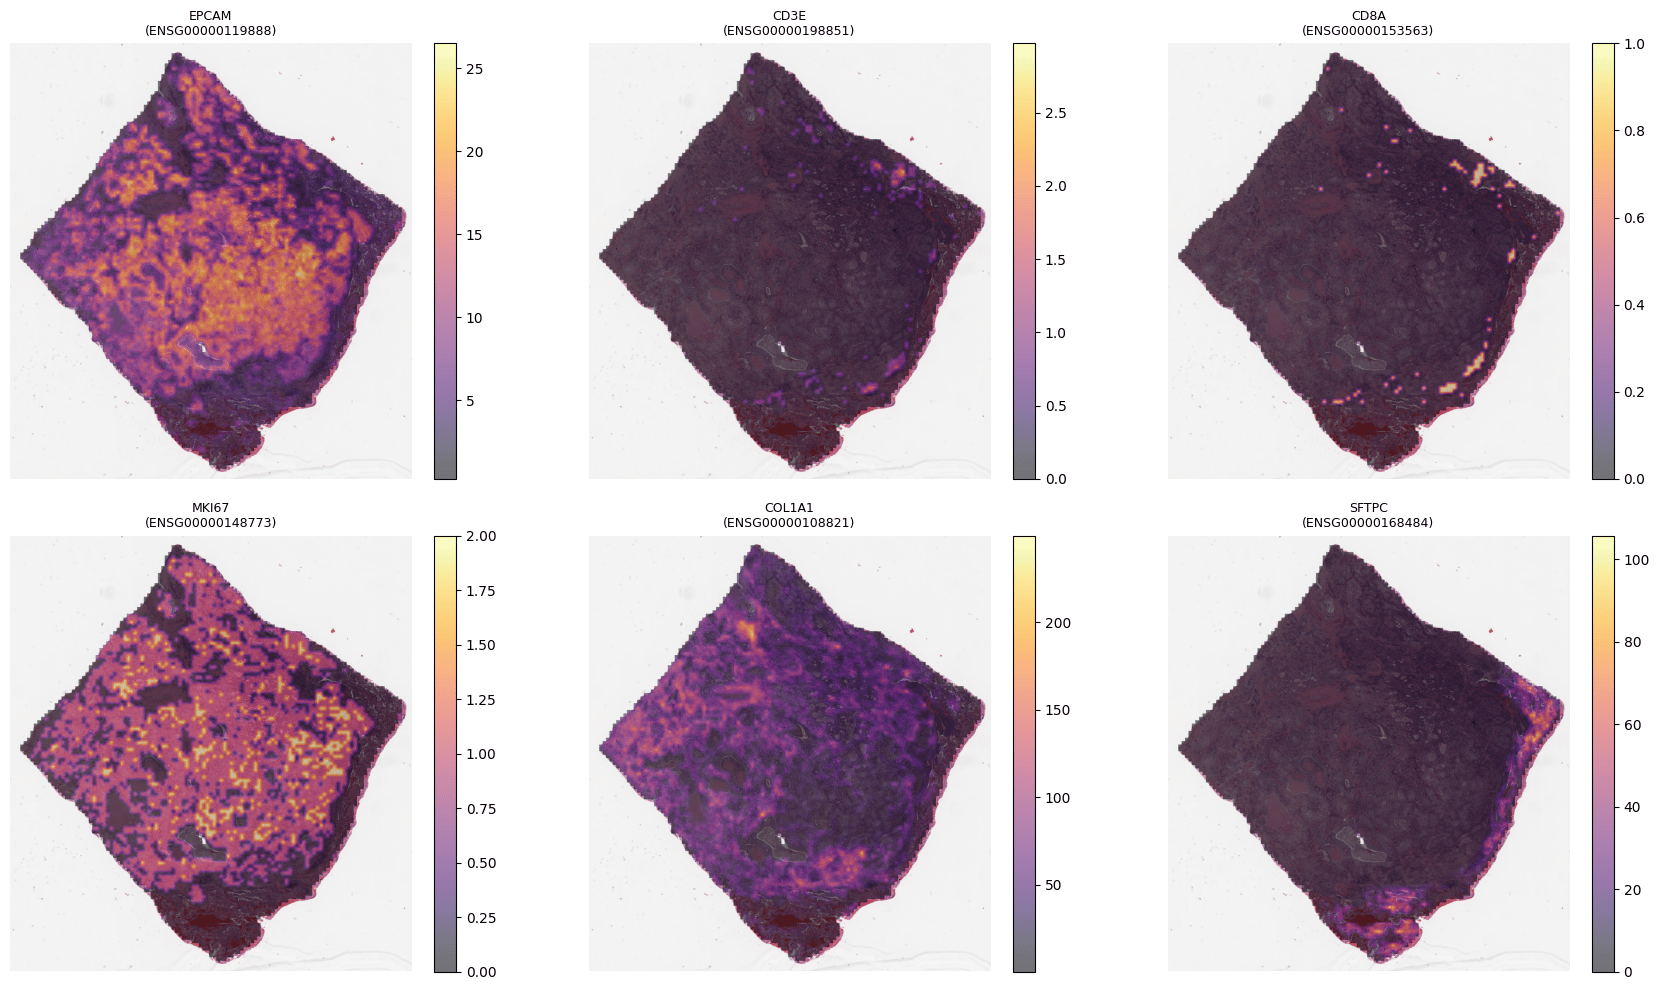
Predicted spatial expression for a six-gene panel on a TCGA-LUAD slide (TCGA-75-7027), M-Optimus with bulk-RNA context.
Image-only vs. bulk-RNA-guided
Compare the same gene predicted with and without bulk RNA context.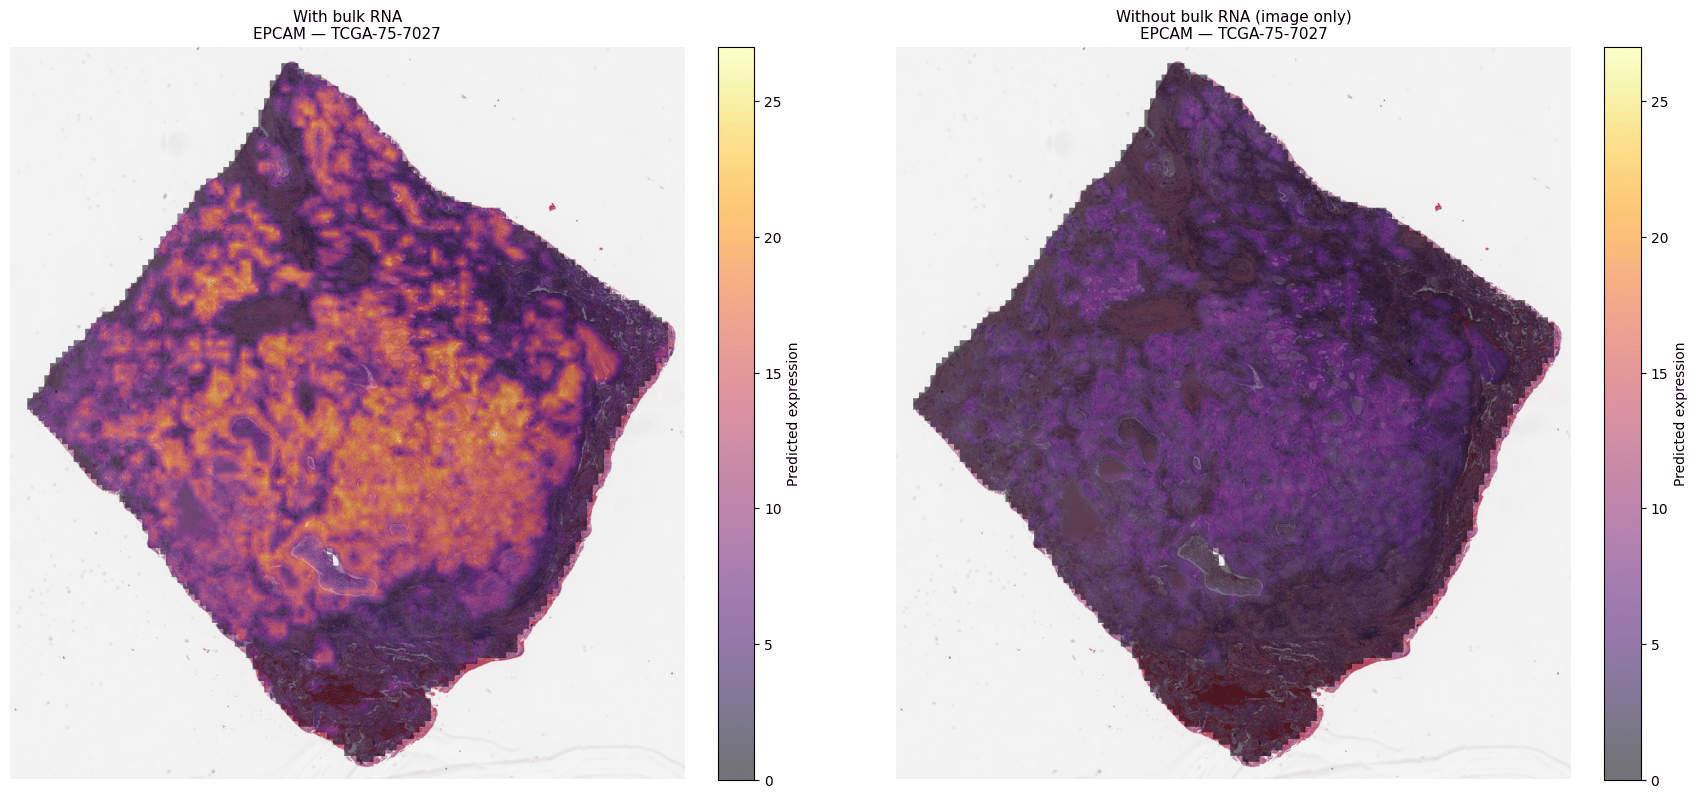
EPCAM predicted from H&E with vs. without bulk RNA (TCGA-LUAD TCGA-75-7027). Bulk RNA sharpens the epithelial signal without retraining.
Highest- and lowest-expressing tiles
Pull the tiles driving a gene’s prediction for quick visual QC.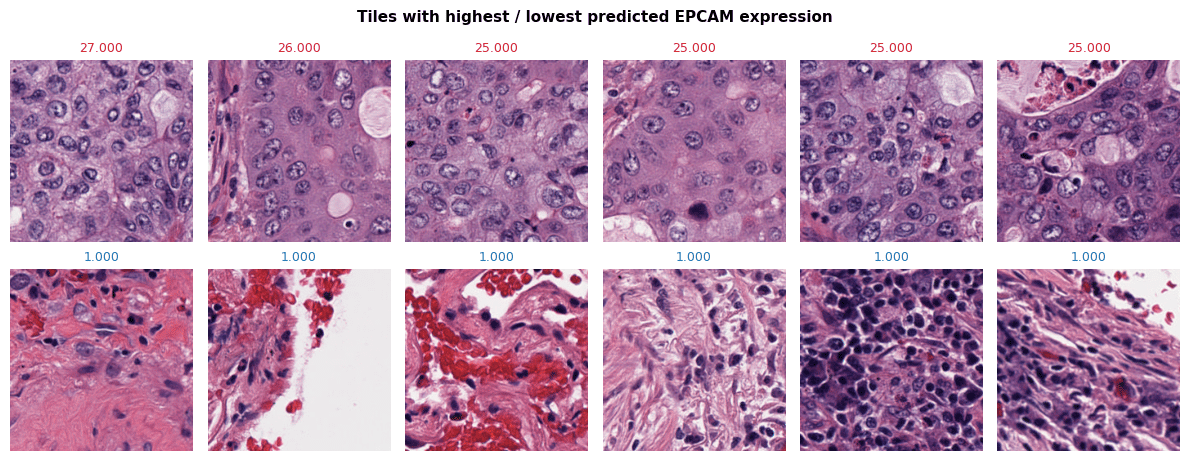
Tiles with the highest and lowest predicted EPCAM expression (TCGA-LUAD TCGA-75-7027).