

Specifications
Reshaping the output
The endpoint returns a flat array. Reshape it to a 512×512 mask:Deploy
Tissue segmentation has no separate deployment — it is bundled with both the H-Optimus and M-Optimus packages and served from the same endpoint. Deploy either model (see the Deployment overview) andtissue-seg is available alongside it.
Using it in a pipeline
In practice you rarely call this endpoint directly — the Bioptimus SDK’s tissue mask provider generates and caches masks for you, then filters tiles before feature extraction or prediction. See Spatial transcriptomics and the Bioptimus SDK. Once masks are generated,bioptimus.utils.plot_slide_and_mask renders the mask next to the slide thumbnail for a quick sanity check:
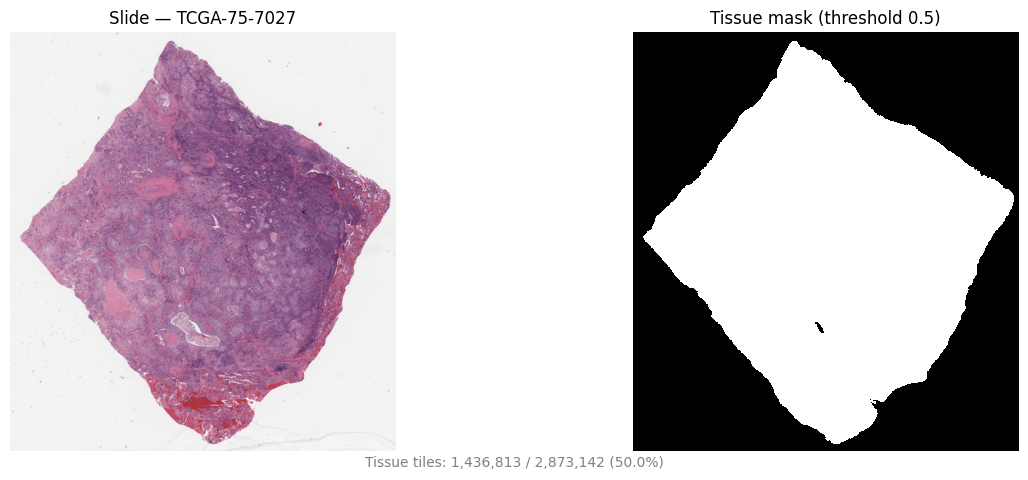
Tissue mask (right) beside the slide thumbnail (left) for a TCGA-LUAD slide (TCGA-75-7027). Background is discarded before feature extraction. Representative example.