

What makes it different
Where H-Optimus stops at features, M-Optimus adds a prediction head over a defined set of output genes. Provide a tile and (optionally) a bulk RNA vector, and it returns predicted expression per output gene — which you can render as spatial heatmaps. Because it is multimodal at both training and inference, it can ingest H&E alone or H&E + bulk RNA, with no retraining needed to benefit from the extra modality.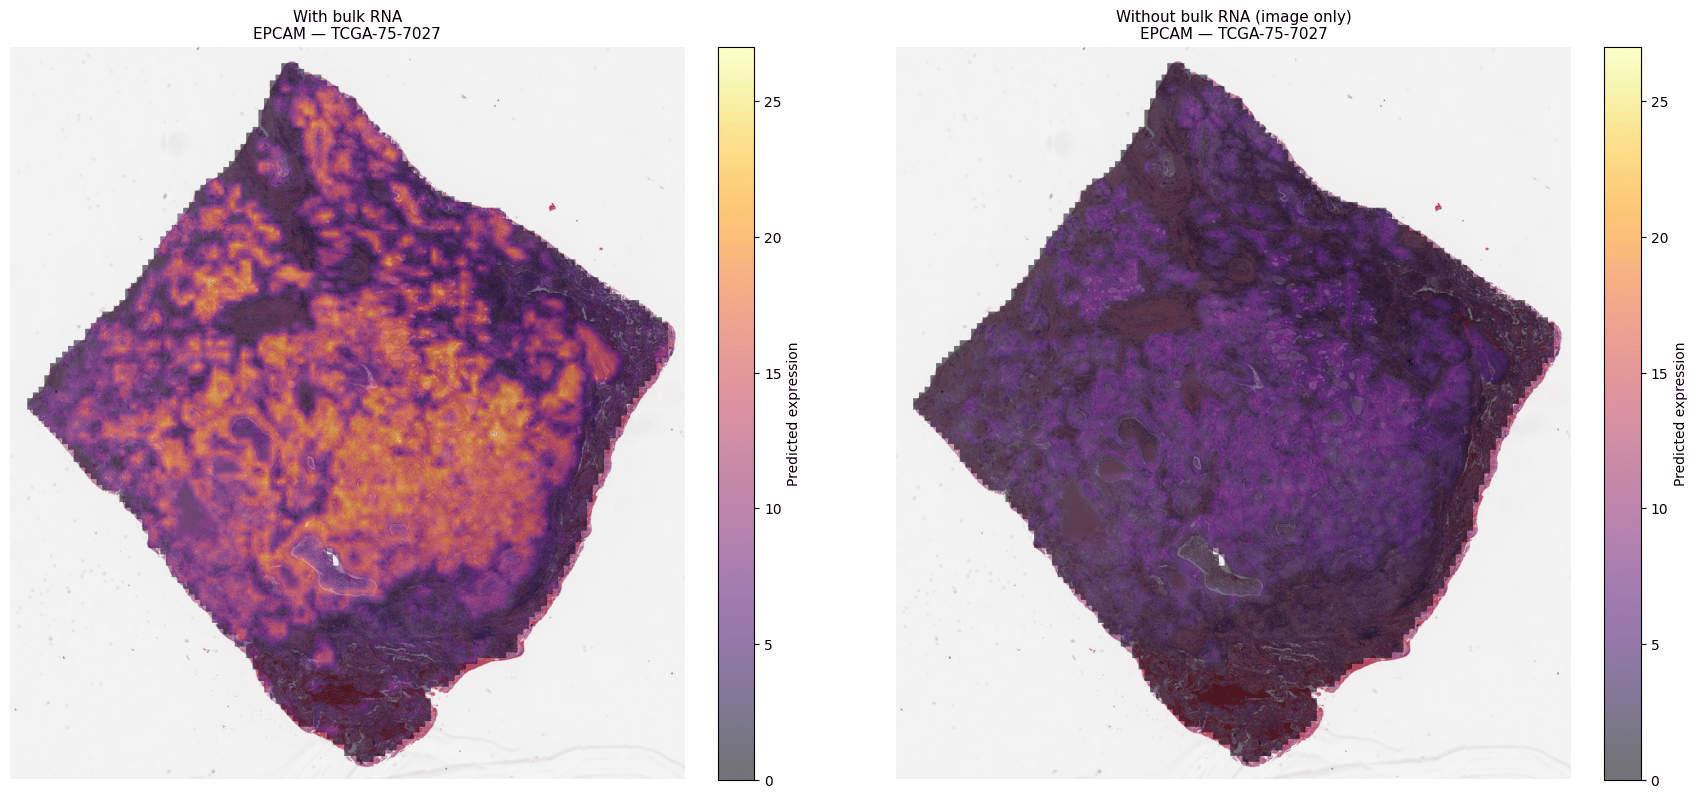
EPCAM expression predicted from H&E on a TCGA-LUAD slide (TCGA-75-7027): image-only vs. bulk-RNA-guided. Adding bulk RNA sharpens the epithelial signal with no retraining. Representative example.
Performance
Results below are from the M-Optimus-1 report; rankings and metrics are task- and dataset-dependent.Modes
- Prediction (spatial gene expression)
- Embedding
- Endpoint:
POST /api/predict/m-optimus - Input: 224×224 tile at 0.5 µm/px, plus optional
bulk_rnaaligned to the model’s input gene set. Omitting bulk RNA uses a zero vector (H&E-only mode). - Output: predicted expression for each output gene.
- Gene sets are available at
GET /api/metadata/m-optimus.
The SDK aligns and reorders your bulk RNA to the model’s input gene set automatically. See Add bulk RNA for the full input contract and transform pipeline.
Specifications
What you can build
M-Optimus turns routine slides into a molecular map for translational research:Biomarker discovery
Surface candidate biomarkers and molecular signatures from H&E at scale.
Patient stratification & trials
Enrich and stratify cohorts; analyze legacy trial slides retrospectively.
Access & deploy
M-Optimus is available now by request. Contact Bioptimus to discuss access, then deploy on AWS SageMaker or on-premise — see the Deployment overview for setup steps.M-Optimus is not available on Hugging Face. For academic-only H&E feature extraction, use H-Optimus on Hugging Face.
Guides
Spatial transcriptomics
Predict spatial gene expression end to end.
Cohorts
Run a model over many slides.