Deploy and build with foundation models for biology — across histology, transcriptomics, and genomics.
Bioptimus builds foundation models that learn the dynamics of human biology across scales — from cell to tissue to organ. This documentation covers how to access, deploy, and build with our models on AWS and on-premise.
Bioptimus models are pretrained on large, diverse histology data, so their representations transfer to many tasks without training from scratch. Point the SDK at a slide and a model, and it tiles the slide, masks out background, runs the model, and writes results to disk. For precise definitions, see the Glossary.
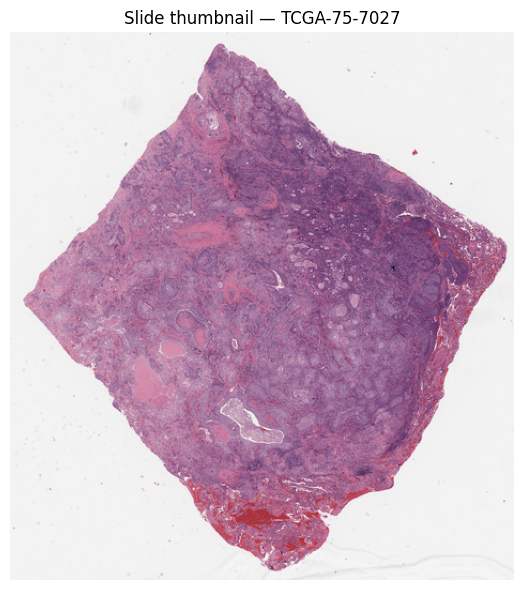
1. Whole slide image
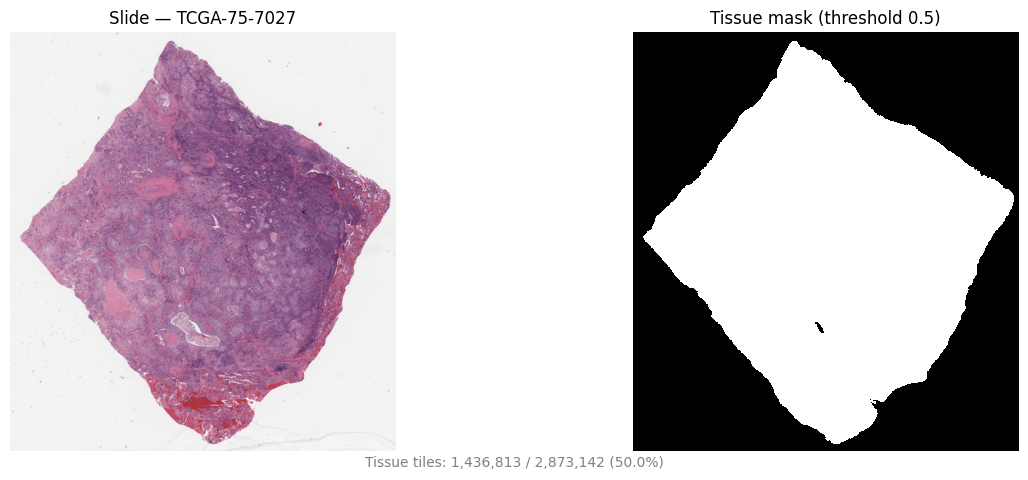
2. Tissue segmentation
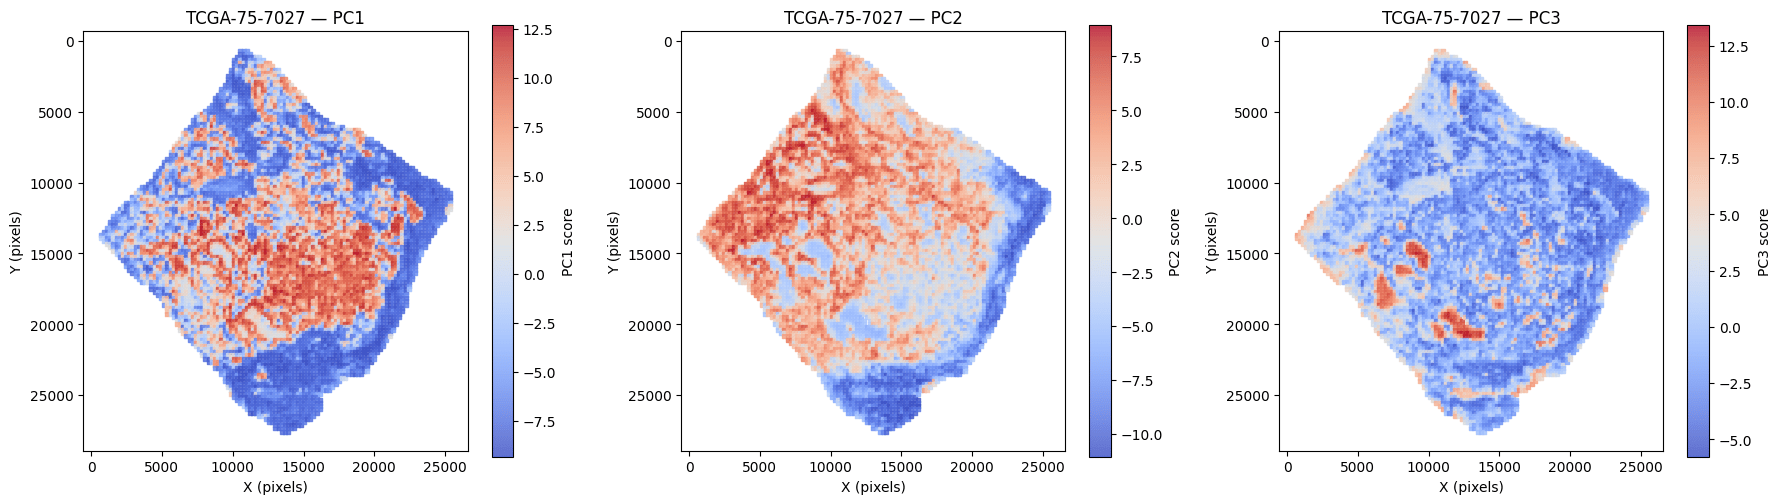
3. Tile embeddings
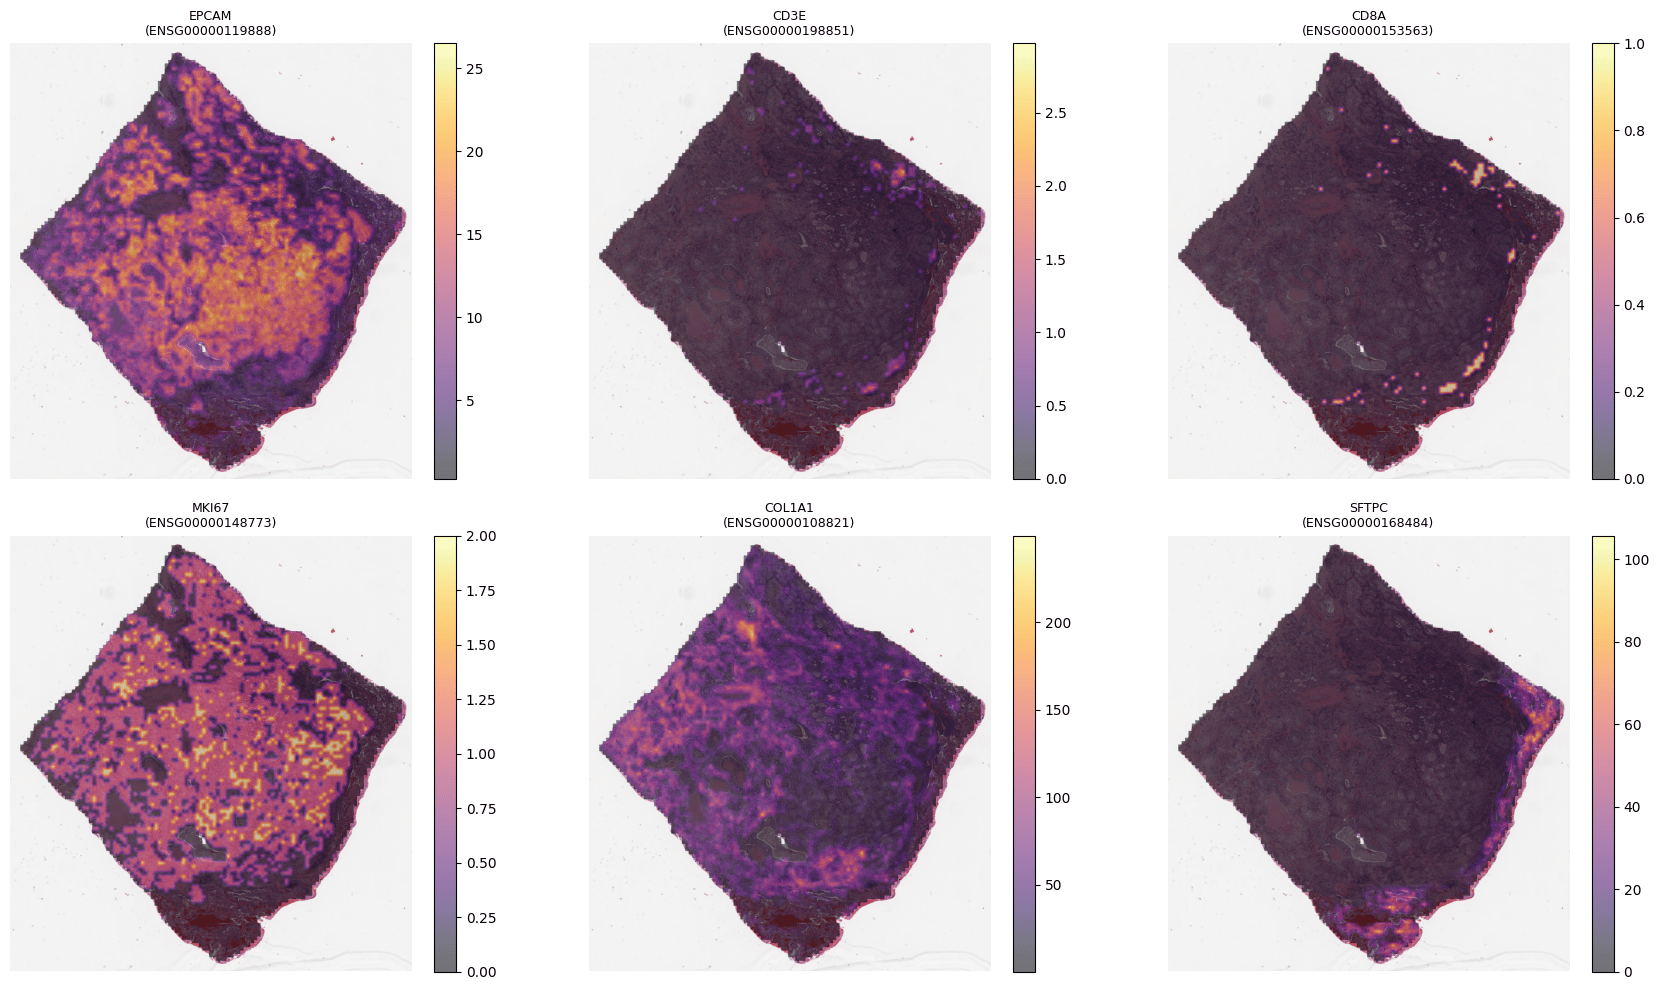
4. Spatial gene expression
A scanned H&E slide can be billions of pixels — too large to process at once — so the pipeline starts from the slide and splits it into small tiles, each processed independently.
Slides are mostly background. The pipeline tiles coarsely (512×512 at 8 µm/pixel) and runs tissue segmentation to produce a tissue map, keeping only tissue-bearing tiles — cutting cost before the expensive feature step.
Tissue mask (right) beside the slide thumbnail (left), TCGA-LUAD TCGA-75-7027. Background is discarded before feature extraction. Representative example.
Tissue tiles (224×224 at 0.5 µm/pixel) are embedded by H-Optimus into a 1536-d feature vector each. Principal components of these embeddings reveal the dominant axes of morphology — tumor, stroma, and immune compartments.
Principal components of tile embeddings mapped back onto the slide (TCGA-LUAD TCGA-75-7027) — PC1–PC3 each isolate a distinct tissue region. Representative example.
M-Optimus produces the same 1536-d embeddings and predicts spatial gene expression directly from each tile (optionally informed by bulk RNA) — a molecular readout without a spatial assay.
Spatial expression for a six-gene panel predicted from H&E (M-Optimus, TCGA-LUAD TCGA-75-7027). Representative example.
Deploy a model and get embeddings back in minutes. For ML engineers and data scientists.
Explore use cases
See how teams use our models for biomarker discovery, indication expansion, and trial design.
Security & compliance
Data handling, residency, and deployment options for regulated environments.
Bioptimus models are for research use and are not approved medical devices. See Responsible use for intended use and your responsibilities.
{"docsConfig":{"theme":"mint","$schema":"https://mintlify.com/docs.json","name":"Bioptimus Documentation","colors":{"primary":"#B82E8C","light":"#E573B0","dark":"#8A2483"},"logo":{"light":"https://mintcdn.com/bioptimus-79a2297b/jGU4HEyHWWwFx0R6/images/Bioptimuslogo_LogoBlackZoomed.png?fit=max\u0026auto=format\u0026n=jGU4HEyHWWwFx0R6\u0026q=85\u0026s=342fb53c57816e6e57175469dc52e5ff","dark":"https://mintcdn.com/bioptimus-79a2297b/sfh98We1LaHyo9gv/images/Bioptimuslogo_LogoWhiteZoomed.png?fit=max\u0026auto=format\u0026n=sfh98We1LaHyo9gv\u0026q=85\u0026s=ec3ec0d8b7c81205999ee104f4b7ccff","href":"https://www.bioptimus.com"},"favicon":{"light":"https://mintcdn.com/bioptimus-79a2297b/Sz6Sf9IwxLJx-SLo/images/bioptimus-icon-256x256.png?fit=max\u0026auto=format\u0026n=Sz6Sf9IwxLJx-SLo\u0026q=85\u0026s=b179b9607976d4f64821314062b432e9","dark":"https://mintcdn.com/bioptimus-79a2297b/Sz6Sf9IwxLJx-SLo/images/bioptimus-icon-256x256.png?fit=max\u0026auto=format\u0026n=Sz6Sf9IwxLJx-SLo\u0026q=85\u0026s=b179b9607976d4f64821314062b432e9"},"api":{"playground":{"display":"simple"}},"background":{"decoration":"gradient","color":{"light":"#F8F8F8","dark":"#17121C"}},"navbar":{"links":[{"href":"mailto:support@bioptimus.com","label":"Support"}],"primary":{"type":"button","label":"Request Access","href":"https://www.bioptimus.com/contact"}},"footer":{"socials":{"linkedin":"https://www.linkedin.com/company/bioptimus","github":"https://github.com/bioptimus","website":"https://www.bioptimus.com"}},"fonts":{"family":"Inter"},"icons":{"library":"fontawesome"},"styling":{"eyebrows":"section","latex":false},"contextual":{"options":["copy","chatgpt","claude"],"display":"header"},"interaction":{"drilldown":true},"markdown":{"schema":true},"navigation":{"global":{"anchors":[{"anchor":"GitHub","icon":"github","href":"https://github.com/bioptimus"},{"anchor":"Knowledge Base","icon":"book-open","href":"https://www.bioptimus.com/knowledge-base"}]},"pages":[]}},"deployment":{"deploymentMetadataValue":{"subdomain":"bioptimus-79a2297b","hasAudioNarration":false,"actualSubdomain":"bioptimus-79a2297b","customDomains":["docs.bioptimus.com"],"gitSource":{"type":"github","owner":"bioptimus","repo":"delivery-docs","deployBranch":"main","contentDirectory":"","isPrivate":true,"mountPath":"","label":""},"chroma":{"collectionId":"fe025c72-bb76-48cc-914b-6a7c4c51a99e","liveDeploymentHistoryId":"6abe2c7804dd3185fd840059","schemaVersion":"v3","latestBuiltDeploymentHistoryId":"6abe2c7804dd3185fd840059"},"feedback":{"thumbs":true,"agentFeedback":true},"entitlements":{"AI_CHAT":{"status":"DISABLED"}},"buildId":"6abe2c7804dd3185fd840059","clientVersion":"0.0.3879","searchFilterCounts":[{"language":"default","tag":"Bioptimus SDK","count":75},{"language":"default","tag":"Reference","count":63},{"language":"default","tag":"Overview","count":16},{"language":"default","tag":"Bioptimus Inference Server","count":13},{"language":"default","tag":"Models","count":12},{"language":"default","tag":"models","count":11},{"language":"default","tag":"Get Started","count":10},{"language":"default","tag":"preprocess","count":10},{"language":"default","tag":"Endpoints","count":10},{"language":"default","tag":"observability","count":9}]},"assistantConfig":{"enableAskAiButton":false,"enableStarterQuestions":false,"enableContextualStarterQuestions":false,"enableAskAiSearchBar":true,"deflection":{"enabled":true,"email":"support@bioptimus.com","showHelpButton":true}},"hasChatPermissions":false,"hasWebMcpPermissions":false,"toggles":[{"name":"kill-isr","enabled":true,"variant":{"name":"disabled","enabled":false,"feature_enabled":true},"impressionData":false},{"name":"agent-mintlify-slack","enabled":true,"variant":{"name":"disabled","enabled":false,"feature_enabled":true},"impressionData":false},{"name":"editor-v7-file-tree","enabled":true,"variant":{"name":"disabled","enabled":false,"feature_enabled":true},"impressionData":false},{"name":"agent-integrations-settings","enabled":true,"variant":{"name":"disabled","enabled":false,"feature_enabled":true},"impressionData":false},{"name":"automations-pr-grouping","enabled":true,"variant":{"name":"disabled","enabled":false,"feature_enabled":true},"impressionData":false},{"name":"custom-prefix","enabled":true,"variant":{"name":"disabled","enabled":false,"feature_enabled":true},"impressionData":false},{"name":"analytics-v7","enabled":true,"variant":{"name":"disabled","enabled":false,"feature_enabled":true},"impressionData":false},{"name":"user-flows-analytics","enabled":true,"variant":{"name":"disabled","enabled":false,"feature_enabled":true},"impressionData":false},{"name":"no-publish-flow","enabled":true,"variant":{"name":"disabled","enabled":false,"feature_enabled":true},"impressionData":false},{"name":"llms-txt-v2","enabled":true,"variant":{"name":"disabled","enabled":false,"feature_enabled":true},"impressionData":false},{"name":"pause-universal-search-reconcile","enabled":true,"variant":{"name":"disabled","enabled":false,"feature_enabled":true},"impressionData":false},{"name":"snapshot-serving-live","enabled":true,"variant":{"name":"disabled","enabled":false,"feature_enabled":true},"impressionData":false},{"name":"stripTemperatureMiddleware","enabled":true,"variant":{"name":"disabled","enabled":false,"feature_enabled":true},"impressionData":false},{"name":"per-site-search-delta","enabled":true,"variant":{"name":"disabled","enabled":false,"feature_enabled":true},"impressionData":false},{"name":"support-platform-pylon-zendesk","enabled":true,"variant":{"name":"disabled","enabled":false,"feature_enabled":true},"impressionData":false},{"name":"editor-branches-v2-autocommit","enabled":true,"variant":{"name":"disabled","enabled":false,"feature_enabled":true},"impressionData":false},{"name":"editor-branches-v2","enabled":true,"variant":{"name":"disabled","enabled":false,"feature_enabled":true},"impressionData":false},{"name":"snapshot-serving","enabled":true,"variant":{"name":"disabled","enabled":false,"feature_enabled":true},"impressionData":false},{"name":"instant-rollback","enabled":true,"variant":{"name":"disabled","enabled":false,"feature_enabled":true},"impressionData":false},{"name":"granular-notifications-server","enabled":true,"variant":{"name":"disabled","enabled":false,"feature_enabled":true},"impressionData":false},{"name":"granular-notifications","enabled":true,"variant":{"name":"disabled","enabled":false,"feature_enabled":true},"impressionData":false},{"name":"editor-private-page-search","enabled":true,"variant":{"name":"disabled","enabled":false,"feature_enabled":true},"impressionData":false},{"name":"automations-fable","enabled":true,"variant":{"name":"disabled","enabled":false,"feature_enabled":true},"impressionData":false},{"name":"fixed-ai-action-pricing","enabled":true,"variant":{"name":"disabled","enabled":false,"feature_enabled":true},"impressionData":false},{"name":"automation-resolve-merge-conflict","enabled":true,"variant":{"name":"disabled","enabled":false,"feature_enabled":true},"impressionData":false},{"name":"scoped-publishing","enabled":true,"variant":{"name":"disabled","enabled":false,"feature_enabled":true},"impressionData":false},{"name":"mintql","enabled":true,"variant":{"name":"disabled","enabled":false,"feature_enabled":true},"impressionData":false},{"name":"page-level-analytics","enabled":true,"variant":{"name":"disabled","enabled":false,"feature_enabled":true},"impressionData":false},{"name":"teamspace","enabled":true,"variant":{"name":"disabled","enabled":false,"feature_enabled":true},"impressionData":false},{"name":"editor-version-history-v2","enabled":true,"variant":{"name":"disabled","enabled":false,"feature_enabled":true},"impressionData":false},{"name":"vite-origin","enabled":true,"variant":{"name":"disabled","enabled":false,"feature_enabled":true},"impressionData":false},{"name":"editor-nav-generations","enabled":true,"variant":{"name":"disabled","enabled":false,"feature_enabled":true},"impressionData":false},{"name":"workspace-projects","enabled":true,"variant":{"name":"disabled","enabled":false,"feature_enabled":true},"impressionData":false},{"name":"assistant-v5","enabled":true,"variant":{"name":"disabled","enabled":false,"feature_enabled":true},"impressionData":false},{"name":"byok-sep-25","enabled":true,"variant":{"name":"disabled","enabled":false,"feature_enabled":true},"impressionData":false},{"name":"revalidation-jwt","enabled":true,"variant":{"name":"disabled","enabled":false,"feature_enabled":true},"impressionData":false},{"name":"editor-agent-model-picker","enabled":true,"variant":{"name":"disabled","enabled":false,"feature_enabled":true},"impressionData":false},{"name":"client-snapshot-docs-config","enabled":true,"variant":{"name":"disabled","enabled":false,"feature_enabled":true},"impressionData":false},{"name":"hobby-abuse-scan","enabled":true,"variant":{"name":"disabled","enabled":false,"feature_enabled":true},"impressionData":false}],"privacy":{"consentBanner":{"enabled":true}},"isAtlas":false,"googleFontsInlined":false},"customCss":[],"page":{"pagePath":"documentation/introduction","slug":"/documentation/introduction","pageMetadata":{"title":"Welcome","description":"Deploy and build with foundation models for biology — across histology, transcriptomics, and genomics.","href":"/documentation/introduction"},"description":{"compiledSource":"\"use strict\";\nconst {jsx: _jsx} = arguments[0];\nconst {useMDXComponents: _provideComponents} = arguments[0];\nfunction _createMdxContent(props) {\n const _components = {\n p: \"p\",\n ..._provideComponents(),\n ...props.components\n };\n return _jsx(_components.p, {\n children: \"Deploy and build with foundation models for biology — across histology, transcriptomics, and genomics.\"\n });\n}\nfunction MDXContent(props = {}) {\n const {wrapper: MDXLayout} = {\n ..._provideComponents(),\n ...props.components\n };\n return MDXLayout ? _jsx(MDXLayout, {\n ...props,\n children: _jsx(_createMdxContent, {\n ...props\n })\n }) : _createMdxContent(props);\n}\nreturn {\n default: MDXContent\n};\n","frontmatter":{},"scope":{}},"pageType":"default","mdx":{"mdxSource":{"compiledSource":"\"use strict\";const{Fragment:_Fragment,jsx:_jsx,jsxs:_jsxs}=arguments[0];const{useMDXComponents:_provideComponents}=arguments[0];function _createMdxContent(props){const _components={a:`a`,p:`p`,strong:`strong`,tbody:`tbody`,td:`td`,th:`th`,thead:`thead`,tr:`tr`,..._provideComponents(),...props.components},{Card,CardGroup,Frame,Heading,OptimizedImage,Tab,Table,Tabs,Warning}=_components;if(!Card)_missingMdxReference(`Card`,true);if(!CardGroup)_missingMdxReference(`CardGroup`,true);if(!Frame)_missingMdxReference(`Frame`,true);if(!Heading)_missingMdxReference(`Heading`,true);if(!OptimizedImage)_missingMdxReference(`OptimizedImage`,true);if(!Tab)_missingMdxReference(`Tab`,true);if(!Table)_missingMdxReference(`Table`,true);if(!Tabs)_missingMdxReference(`Tabs`,true);if(!Warning)_missingMdxReference(`Warning`,true);return _jsxs(_Fragment,{children:[_jsx(_components.p,{children:`Bioptimus builds foundation models that learn the dynamics of human biology across scales — from cell to tissue to organ. This documentation covers how to access, deploy, and build with our models on AWS and on-premise.`}),`\n`,_jsx(Heading,{level:`2`,id:`how-it-works`,children:`How it works`}),`\n`,_jsxs(_components.p,{children:[`Bioptimus models are pretrained on large, diverse histology data, so their representations transfer to many tasks without training from scratch. Point the SDK at a slide and a model, and it tiles the slide, masks out background, runs the model, and writes results to disk. For precise definitions, see the `,_jsx(_components.a,{href:`/documentation/resources/glossary`,children:`Glossary`}),`.`]}),`\n`,_jsxs(Tabs,{children:[_jsxs(Tab,{title:`1. Whole slide image`,id:`1-whole-slide-image`,children:[_jsxs(_components.p,{children:[`A scanned H\u0026E slide can be `,_jsx(_components.strong,{children:`billions of pixels`}),` — too large to process at once — so the pipeline starts from the slide and splits it into small tiles, each processed independently.`]}),_jsx(Frame,{caption:`H\u0026E whole-slide image (TCGA-LUAD TCGA-75-7027). Representative example.`,children:_jsx(OptimizedImage,{src:`https://mintcdn.com/bioptimus-79a2297b/v6DGwj65gtzYzRw4/images/figures/wsi-thumbnail-luad.png?fit=max\u0026auto=format\u0026n=v6DGwj65gtzYzRw4\u0026q=85\u0026s=e32139d35e36cdf9e0993e686299ffa4`,alt:`H\u0026E whole-slide image thumbnail`,\"data-og-width\":`523`,width:`523`,\"data-og-height\":`590`,height:`590`,\"data-path\":`images/figures/wsi-thumbnail-luad.png`,\"data-optimize\":`true`,\"data-opv\":`3`,srcset:`https://mintcdn.com/bioptimus-79a2297b/v6DGwj65gtzYzRw4/images/figures/wsi-thumbnail-luad.png?w=280\u0026fit=max\u0026auto=format\u0026n=v6DGwj65gtzYzRw4\u0026q=85\u0026s=c42ebdfd4c21085ac58fcca2157fee96 280w, https://mintcdn.com/bioptimus-79a2297b/v6DGwj65gtzYzRw4/images/figures/wsi-thumbnail-luad.png?w=560\u0026fit=max\u0026auto=format\u0026n=v6DGwj65gtzYzRw4\u0026q=85\u0026s=48237af076d3398ed3d674d398495ec6 560w, https://mintcdn.com/bioptimus-79a2297b/v6DGwj65gtzYzRw4/images/figures/wsi-thumbnail-luad.png?w=840\u0026fit=max\u0026auto=format\u0026n=v6DGwj65gtzYzRw4\u0026q=85\u0026s=146c882322b8957e78ac4c82762cb92d 840w, https://mintcdn.com/bioptimus-79a2297b/v6DGwj65gtzYzRw4/images/figures/wsi-thumbnail-luad.png?w=1100\u0026fit=max\u0026auto=format\u0026n=v6DGwj65gtzYzRw4\u0026q=85\u0026s=cf3bc0e5bd41a8b45d124c29ff2ef1b1 1100w, https://mintcdn.com/bioptimus-79a2297b/v6DGwj65gtzYzRw4/images/figures/wsi-thumbnail-luad.png?w=1650\u0026fit=max\u0026auto=format\u0026n=v6DGwj65gtzYzRw4\u0026q=85\u0026s=d7b20e34af5442cb75e6414e743b3f53 1650w, https://mintcdn.com/bioptimus-79a2297b/v6DGwj65gtzYzRw4/images/figures/wsi-thumbnail-luad.png?w=2500\u0026fit=max\u0026auto=format\u0026n=v6DGwj65gtzYzRw4\u0026q=85\u0026s=26f38bc47ddccf90bb15089e52559a66 2500w`})})]}),_jsxs(Tab,{title:`2. Tissue segmentation`,id:`2-tissue-segmentation`,children:[_jsxs(_components.p,{children:[`Slides are mostly background. The pipeline tiles coarsely (512×512 at 8 µm/pixel) and runs `,_jsx(_components.a,{href:`/documentation/models/tissue-segmentation`,children:`tissue segmentation`}),` to produce a tissue map, keeping only tissue-bearing tiles — cutting cost before the expensive feature step.`]}),_jsx(Frame,{caption:`Tissue mask (right) beside the slide thumbnail (left), TCGA-LUAD TCGA-75-7027. Background is discarded before feature extraction. Representative example.`,children:_jsx(OptimizedImage,{src:`https://mintcdn.com/bioptimus-79a2297b/wzVDcCnzT959rZil/images/figures/tissue-mask-overlay.png?fit=max\u0026auto=format\u0026n=wzVDcCnzT959rZil\u0026q=85\u0026s=87a8dc92ffd6911fc6305d1d59b3b2fa`,alt:`Slide thumbnail alongside its binary tissue mask`,\"data-og-width\":`1028`,width:`1028`,\"data-og-height\":`480`,height:`480`,\"data-path\":`images/figures/tissue-mask-overlay.png`,\"data-optimize\":`true`,\"data-opv\":`3`,srcset:`https://mintcdn.com/bioptimus-79a2297b/wzVDcCnzT959rZil/images/figures/tissue-mask-overlay.png?w=280\u0026fit=max\u0026auto=format\u0026n=wzVDcCnzT959rZil\u0026q=85\u0026s=ab69ea3be7d55c45901e1646b9b7e316 280w, https://mintcdn.com/bioptimus-79a2297b/wzVDcCnzT959rZil/images/figures/tissue-mask-overlay.png?w=560\u0026fit=max\u0026auto=format\u0026n=wzVDcCnzT959rZil\u0026q=85\u0026s=d09645aaa996f9d44725b45452a5fee6 560w, https://mintcdn.com/bioptimus-79a2297b/wzVDcCnzT959rZil/images/figures/tissue-mask-overlay.png?w=840\u0026fit=max\u0026auto=format\u0026n=wzVDcCnzT959rZil\u0026q=85\u0026s=17cc23840423513aa65c203fef30730a 840w, https://mintcdn.com/bioptimus-79a2297b/wzVDcCnzT959rZil/images/figures/tissue-mask-overlay.png?w=1100\u0026fit=max\u0026auto=format\u0026n=wzVDcCnzT959rZil\u0026q=85\u0026s=902d15d5c73e833cdc6376352f6cac68 1100w, https://mintcdn.com/bioptimus-79a2297b/wzVDcCnzT959rZil/images/figures/tissue-mask-overlay.png?w=1650\u0026fit=max\u0026auto=format\u0026n=wzVDcCnzT959rZil\u0026q=85\u0026s=f0b42c2189b57e851a632b704393ad13 1650w, https://mintcdn.com/bioptimus-79a2297b/wzVDcCnzT959rZil/images/figures/tissue-mask-overlay.png?w=2500\u0026fit=max\u0026auto=format\u0026n=wzVDcCnzT959rZil\u0026q=85\u0026s=293a2afac37ce057aaf9a8f1b8eb5fbe 2500w`})})]}),_jsxs(Tab,{title:`3. Tile embeddings`,id:`3-tile-embeddings`,children:[_jsxs(_components.p,{children:[`Tissue tiles (224×224 at 0.5 µm/pixel) are embedded by `,_jsx(_components.a,{href:`/documentation/models/h-optimus`,children:`H-Optimus`}),` into a `,_jsx(_components.strong,{children:`1536-d feature vector`}),` each. Principal components of these embeddings reveal the dominant axes of morphology — tumor, stroma, and immune compartments.`]}),_jsx(Frame,{caption:`Principal components of tile embeddings mapped back onto the slide (TCGA-LUAD TCGA-75-7027) — PC1–PC3 each isolate a distinct tissue region. Representative example.`,children:_jsx(OptimizedImage,{src:`https://mintcdn.com/bioptimus-79a2297b/wzVDcCnzT959rZil/images/figures/embeddings-pca-spatial.png?fit=max\u0026auto=format\u0026n=wzVDcCnzT959rZil\u0026q=85\u0026s=b025c90df2d995becf9aa8c78f139f38`,alt:`Spatial heatmaps of the first three principal components of tile embeddings`,\"data-og-width\":`1781`,width:`1781`,\"data-og-height\":`504`,height:`504`,\"data-path\":`images/figures/embeddings-pca-spatial.png`,\"data-optimize\":`true`,\"data-opv\":`3`,srcset:`https://mintcdn.com/bioptimus-79a2297b/wzVDcCnzT959rZil/images/figures/embeddings-pca-spatial.png?w=280\u0026fit=max\u0026auto=format\u0026n=wzVDcCnzT959rZil\u0026q=85\u0026s=2f17b85b78bd739d4877b5aee07d813c 280w, https://mintcdn.com/bioptimus-79a2297b/wzVDcCnzT959rZil/images/figures/embeddings-pca-spatial.png?w=560\u0026fit=max\u0026auto=format\u0026n=wzVDcCnzT959rZil\u0026q=85\u0026s=5a0ce4853d6ba2a5267ea4e108d839f5 560w, https://mintcdn.com/bioptimus-79a2297b/wzVDcCnzT959rZil/images/figures/embeddings-pca-spatial.png?w=840\u0026fit=max\u0026auto=format\u0026n=wzVDcCnzT959rZil\u0026q=85\u0026s=e76217a3595d66259f156583325af103 840w, https://mintcdn.com/bioptimus-79a2297b/wzVDcCnzT959rZil/images/figures/embeddings-pca-spatial.png?w=1100\u0026fit=max\u0026auto=format\u0026n=wzVDcCnzT959rZil\u0026q=85\u0026s=e50cc96d179e9ee1de4eb72c3915406e 1100w, https://mintcdn.com/bioptimus-79a2297b/wzVDcCnzT959rZil/images/figures/embeddings-pca-spatial.png?w=1650\u0026fit=max\u0026auto=format\u0026n=wzVDcCnzT959rZil\u0026q=85\u0026s=6b182176ecb58d2b2e4cd95053b50315 1650w, https://mintcdn.com/bioptimus-79a2297b/wzVDcCnzT959rZil/images/figures/embeddings-pca-spatial.png?w=2500\u0026fit=max\u0026auto=format\u0026n=wzVDcCnzT959rZil\u0026q=85\u0026s=222b00f0134c9e3a5aeedb940d1e047a 2500w`})})]}),_jsxs(Tab,{title:`4. Spatial gene expression`,id:`4-spatial-gene-expression`,children:[_jsxs(_components.p,{children:[_jsx(_components.a,{href:`/documentation/models/m-optimus`,children:`M-Optimus`}),` produces the same 1536-d embeddings `,_jsx(_components.strong,{children:`and`}),` predicts spatial gene expression directly from each tile (optionally informed by bulk RNA) — a molecular readout without a spatial assay.`]}),_jsx(Frame,{caption:`Spatial expression for a six-gene panel predicted from H\u0026E (M-Optimus, TCGA-LUAD TCGA-75-7027). Representative example.`,children:_jsx(OptimizedImage,{src:`https://mintcdn.com/bioptimus-79a2297b/wzVDcCnzT959rZil/images/figures/gene-panel-overlay-bulk.png?fit=max\u0026auto=format\u0026n=wzVDcCnzT959rZil\u0026q=85\u0026s=5d1d3503a8ec780b4741ea1ce2fcd500`,alt:`Spatial gene-expression panel predicted from H\u0026E by M-Optimus`,\"data-og-width\":`1659`,width:`1659`,\"data-og-height\":`990`,height:`990`,\"data-path\":`images/figures/gene-panel-overlay-bulk.png`,\"data-optimize\":`true`,\"data-opv\":`3`,srcset:`https://mintcdn.com/bioptimus-79a2297b/wzVDcCnzT959rZil/images/figures/gene-panel-overlay-bulk.png?w=280\u0026fit=max\u0026auto=format\u0026n=wzVDcCnzT959rZil\u0026q=85\u0026s=07dd9225df853f9e2f589004dfcdf624 280w, https://mintcdn.com/bioptimus-79a2297b/wzVDcCnzT959rZil/images/figures/gene-panel-overlay-bulk.png?w=560\u0026fit=max\u0026auto=format\u0026n=wzVDcCnzT959rZil\u0026q=85\u0026s=f6cd936e7ddf19209956cb52901258ca 560w, https://mintcdn.com/bioptimus-79a2297b/wzVDcCnzT959rZil/images/figures/gene-panel-overlay-bulk.png?w=840\u0026fit=max\u0026auto=format\u0026n=wzVDcCnzT959rZil\u0026q=85\u0026s=e6d16c4a095d30d0e09163338f2bce1e 840w, https://mintcdn.com/bioptimus-79a2297b/wzVDcCnzT959rZil/images/figures/gene-panel-overlay-bulk.png?w=1100\u0026fit=max\u0026auto=format\u0026n=wzVDcCnzT959rZil\u0026q=85\u0026s=4e04a568619f783a4e16cf1572868efa 1100w, https://mintcdn.com/bioptimus-79a2297b/wzVDcCnzT959rZil/images/figures/gene-panel-overlay-bulk.png?w=1650\u0026fit=max\u0026auto=format\u0026n=wzVDcCnzT959rZil\u0026q=85\u0026s=6ff6fe107952a52f31e67abe8cc3a7ee 1650w, https://mintcdn.com/bioptimus-79a2297b/wzVDcCnzT959rZil/images/figures/gene-panel-overlay-bulk.png?w=2500\u0026fit=max\u0026auto=format\u0026n=wzVDcCnzT959rZil\u0026q=85\u0026s=796dd3ae35e8142077f11be8ffaf2a31 2500w`})})]})]}),`\n`,_jsx(Heading,{level:`2`,id:`the-models`,children:`The models`}),`\n`,_jsxs(CardGroup,{cols:2,children:[_jsx(Card,{title:`H-Optimus`,href:`/documentation/models/h-optimus`,children:_jsx(_components.p,{children:`A vision foundation model for histology. Extracts tile-level features from H\u0026E whole slide images.`})}),_jsx(Card,{title:`M-Optimus`,href:`/documentation/models/m-optimus`,children:_jsx(_components.p,{children:`A multimodal, multi-scale model (M-Optimus-1) that predicts spatial gene expression from routine H\u0026E, refined with bulk RNA.`})})]}),`\n`,_jsx(_components.p,{children:`Both models are trained on data from STELA, our data engine:`}),`\n`,_jsx(Card,{title:`STELA — data engine`,icon:`database`,href:`https://www.bioptimus.com/stela`,children:_jsx(_components.p,{children:`A multi-institutional data engine generating the deeply profiled, clinically linked patient data our models train on.`})}),`\n`,_jsx(Heading,{level:`2`,id:`where-to-get-each-model`,children:`Where to get each model`}),`\n`,_jsx(_components.p,{children:`A quick map of which model is available on which channel, and where to start.`}),`\n`,_jsxs(Table,{children:[_jsx(_components.thead,{children:_jsxs(_components.tr,{children:[_jsx(_components.th,{children:`Model`}),_jsx(_components.th,{children:`AWS SageMaker`}),_jsx(_components.th,{children:`On-premise`}),_jsx(_components.th,{children:`Hugging Face`}),_jsx(_components.th,{children:`Proscia`})]})}),_jsxs(_components.tbody,{children:[_jsxs(_components.tr,{children:[_jsx(_components.td,{children:_jsx(_components.strong,{children:`H-Optimus`})}),_jsxs(_components.td,{children:[`✅ `,_jsx(_components.a,{href:`/deployment/platforms/aws-sagemaker`,children:`Deploy`})]}),_jsxs(_components.td,{children:[`✅ `,_jsx(_components.a,{href:`/deployment/platforms/on-premise`,children:`Deploy`})]}),_jsxs(_components.td,{children:[`✅ `,_jsx(_components.a,{href:`/deployment/platforms/hugging-face`,children:`Academic`})]}),_jsxs(_components.td,{children:[`✅ `,_jsx(_components.a,{href:`/deployment/platforms/proscia`,children:`Concentriq® LS`})]})]}),_jsxs(_components.tr,{children:[_jsx(_components.td,{children:_jsx(_components.strong,{children:`M-Optimus`})}),_jsxs(_components.td,{children:[`✅ `,_jsx(_components.a,{href:`/deployment/platforms/aws-sagemaker`,children:`Deploy`})]}),_jsxs(_components.td,{children:[`✅ `,_jsx(_components.a,{href:`/deployment/platforms/on-premise`,children:`Deploy`})]}),_jsx(_components.td,{children:`—`}),_jsx(_components.td,{children:`—`})]}),_jsxs(_components.tr,{children:[_jsx(_components.td,{children:_jsx(_components.strong,{children:`Tissue segmentation`})}),_jsx(_components.td,{children:`✅ (bundled)`}),_jsx(_components.td,{children:`✅ (bundled)`}),_jsx(_components.td,{children:`—`}),_jsx(_components.td,{children:`—`})]})]})]}),`\n`,_jsxs(CardGroup,{cols:2,children:[_jsx(Card,{title:`AWS SageMaker`,href:`/deployment/platforms/aws-sagemaker`,children:_jsx(_components.p,{children:`Managed endpoints from AWS Marketplace.`})}),_jsx(Card,{title:`On-premise`,href:`/deployment/platforms/on-premise`,children:_jsx(_components.p,{children:`Self-hosted container for full data control.`})}),_jsx(Card,{title:`Hugging Face`,href:`/deployment/platforms/hugging-face`,children:_jsx(_components.p,{children:`H-Optimus weights for non-commercial academic use.`})}),_jsx(Card,{title:`Proscia`,href:`/deployment/platforms/proscia`,children:_jsx(_components.p,{children:`H-Optimus embeddings for slides in Concentriq® LS.`})})]}),`\n`,_jsx(Heading,{level:`2`,id:`where-to-start`,children:`Where to start`}),`\n`,_jsxs(CardGroup,{cols:3,children:[_jsx(Card,{title:`Run your first inference`,href:`/documentation/quickstart`,children:_jsx(_components.p,{children:`Deploy a model and get embeddings back in minutes. For ML engineers and data scientists.`})}),_jsx(Card,{title:`Explore use cases`,href:`/documentation/use-cases/biomarker-discovery`,children:_jsx(_components.p,{children:`See how teams use our models for biomarker discovery, indication expansion, and trial design.`})}),_jsx(Card,{title:`Security \u0026 compliance`,href:`/documentation/resources/security-compliance`,children:_jsx(_components.p,{children:`Data handling, residency, and deployment options for regulated environments.`})})]}),`\n`,_jsx(Warning,{children:_jsxs(_components.p,{children:[`Bioptimus models are for `,_jsx(_components.strong,{children:`research use`}),` and are not approved medical devices. See `,_jsx(_components.a,{href:`/documentation/resources/responsible-use`,children:`Responsible use`}),` for intended use and your responsibilities.`]})})]})}function MDXContent(props={}){const{wrapper:MDXLayout}={..._provideComponents(),...props.components};return MDXLayout?_jsx(MDXLayout,{...props,children:_jsx(_createMdxContent,{...props})}):_createMdxContent(props)}return{default:MDXContent};function _missingMdxReference(id,component){throw new Error(`Expected `+(component?`component`:`object`)+\" `\"+id+\"` to be defined: you likely forgot to import, pass, or provide it.\")}","frontmatter":{},"scope":{"config":{},"pageMetadata":{"title":"Welcome","description":"Deploy and build with foundation models for biology — across histology, transcriptomics, and genomics.","href":"/documentation/introduction"}}},"mdxSourceWithNoJs":null},"mdxExtracts":{"tableOfContents":[{"title":"How it works","slug":"how-it-works","depth":2,"children":[]},{"title":"The models","slug":"the-models","depth":2,"children":[]},{"title":"Where to get each model","slug":"where-to-get-each-model","depth":2,"children":[]},{"title":"Where to start","slug":"where-to-start","depth":2,"children":[]}],"codeExamples":{}},"jsLinks":[],"subdomain":"bioptimus-79a2297b","siteName":"Bioptimus Documentation","title":"Welcome - Bioptimus Documentation","navMaps":{"firstHrefInVersion":{},"firstHrefInLanguage":{}},"lastModified":"2026-09-21T11:34:02.536Z","originalFileLocation":"documentation/introduction.mdx"},"headHtml":"\u003cmeta data-mint-head name=\"description\" content=\"Deploy and build with foundation models for biology — across histology, transcriptomics, and genomics.\">\u003cmeta data-mint-head name=\"application-name\" content=\"Bioptimus Documentation\">\u003cmeta data-mint-head name=\"generator\" content=\"Mintlify\">\u003clink data-mint-head rel=\"icon\" type=\"image/png\" sizes=\"192x192\" href=\"/mintlify-assets/_mintlify/favicons/bioptimus-79a2297b/8-XspAxxOMVS2JSU/_generated/favicon/android-chrome-192x192.png\" media=\"(prefers-color-scheme: light)\">\u003clink data-mint-head rel=\"apple-touch-icon\" type=\"image/png\" sizes=\"180x180\" href=\"/mintlify-assets/_mintlify/favicons/bioptimus-79a2297b/8-XspAxxOMVS2JSU/_generated/favicon/apple-touch-icon.png\">\u003clink data-mint-head rel=\"icon\" type=\"image/png\" sizes=\"16x16\" href=\"/mintlify-assets/_mintlify/favicons/bioptimus-79a2297b/8-XspAxxOMVS2JSU/_generated/favicon/favicon-16x16.png\" media=\"(prefers-color-scheme: light)\">\u003clink data-mint-head rel=\"icon\" type=\"image/png\" sizes=\"32x32\" href=\"/mintlify-assets/_mintlify/favicons/bioptimus-79a2297b/8-XspAxxOMVS2JSU/_generated/favicon/favicon-32x32.png\" media=\"(prefers-color-scheme: light)\">\u003clink data-mint-head rel=\"shortcut icon\" type=\"image/x-icon\" href=\"/mintlify-assets/_mintlify/favicons/bioptimus-79a2297b/8-XspAxxOMVS2JSU/_generated/favicon/favicon.ico\" media=\"(prefers-color-scheme: light)\">\u003clink data-mint-head rel=\"icon\" type=\"image/png\" sizes=\"192x192\" href=\"/mintlify-assets/_mintlify/favicons/bioptimus-79a2297b/8-XspAxxOMVS2JSU/_generated/favicon-dark/android-chrome-192x192.png\" media=\"(prefers-color-scheme: dark)\">\u003clink data-mint-head rel=\"icon\" type=\"image/png\" sizes=\"16x16\" href=\"/mintlify-assets/_mintlify/favicons/bioptimus-79a2297b/8-XspAxxOMVS2JSU/_generated/favicon-dark/favicon-16x16.png\" media=\"(prefers-color-scheme: dark)\">\u003clink data-mint-head rel=\"icon\" type=\"image/png\" sizes=\"32x32\" href=\"/mintlify-assets/_mintlify/favicons/bioptimus-79a2297b/8-XspAxxOMVS2JSU/_generated/favicon-dark/favicon-32x32.png\" media=\"(prefers-color-scheme: dark)\">\u003clink data-mint-head rel=\"shortcut icon\" type=\"image/x-icon\" href=\"/mintlify-assets/_mintlify/favicons/bioptimus-79a2297b/8-XspAxxOMVS2JSU/_generated/favicon-dark/favicon.ico\" media=\"(prefers-color-scheme: dark)\">\u003cmeta data-mint-head property=\"og:title\" content=\"Welcome - Bioptimus Documentation\">\u003cmeta data-mint-head property=\"og:description\" content=\"Deploy and build with foundation models for biology — across histology, transcriptomics, and genomics.\">\u003cmeta data-mint-head property=\"og:site_name\" content=\"Bioptimus Documentation\">\u003cmeta data-mint-head property=\"og:url\" content=\"https://docs.bioptimus.com/documentation/introduction\">\u003cmeta data-mint-head property=\"og:type\" content=\"website\">\u003cmeta data-mint-head name=\"twitter:card\" content=\"summary_large_image\">\u003cmeta data-mint-head name=\"twitter:title\" content=\"Welcome - Bioptimus Documentation\">\u003cmeta data-mint-head name=\"twitter:description\" content=\"Deploy and build with foundation models for biology — across histology, transcriptomics, and genomics.\">\u003cmeta data-mint-head name=\"msapplication-config\" content=\"/mintlify-assets/_mintlify/favicons/bioptimus-79a2297b/8-XspAxxOMVS2JSU/_generated/favicon/browserconfig.xml\">\u003cmeta data-mint-head name=\"apple-mobile-web-app-title\" content=\"Bioptimus Documentation\">\u003cmeta data-mint-head name=\"msapplication-TileColor\" content=\"#B82E8C\">\u003clink data-mint-head rel=\"canonical\" href=\"https://docs.bioptimus.com/documentation/introduction\">\u003clink data-mint-head rel=\"alternate\" type=\"application/xml\" href=\"/sitemap.xml\">\u003clink data-mint-head rel=\"alternate\" type=\"text/markdown\" href=\"/documentation/introduction.md\">\u003cscript data-mint-head type=\"application/ld+json\">{\"@context\":\"https://schema.org\",\"@graph\":[{\"@type\":\"Organization\",\"@id\":\"https://docs.bioptimus.com/#organization\",\"name\":\"Bioptimus Documentation\",\"url\":\"https://docs.bioptimus.com\",\"logo\":{\"@type\":\"ImageObject\",\"url\":\"https://mintcdn.com/bioptimus-79a2297b/jGU4HEyHWWwFx0R6/images/Bioptimuslogo_LogoBlackZoomed.png?fit=max\u0026auto=format\u0026n=jGU4HEyHWWwFx0R6\u0026q=85\u0026s=342fb53c57816e6e57175469dc52e5ff\"}},{\"@type\":\"WebSite\",\"@id\":\"https://docs.bioptimus.com#website\",\"name\":\"Bioptimus Documentation\",\"url\":\"https://docs.bioptimus.com\",\"publisher\":{\"@id\":\"https://docs.bioptimus.com/#organization\"}},{\"@type\":\"WebPage\",\"@id\":\"https://docs.bioptimus.com/documentation/introduction#webpage\",\"url\":\"https://docs.bioptimus.com/documentation/introduction\",\"name\":\"Welcome\",\"description\":\"Deploy and build with foundation models for biology — across histology, transcriptomics, and genomics.\",\"dateModified\":\"2026-09-21T11:34:02.536Z\",\"isPartOf\":{\"@id\":\"https://docs.bioptimus.com#website\"},\"breadcrumb\":{\"@id\":\"https://docs.bioptimus.com/documentation/introduction#breadcrumb\"}},{\"@type\":\"BreadcrumbList\",\"@id\":\"https://docs.bioptimus.com/documentation/introduction#breadcrumb\",\"itemListElement\":[{\"@type\":\"ListItem\",\"position\":1,\"name\":\"Bioptimus Documentation\",\"item\":\"https://docs.bioptimus.com\"},{\"@type\":\"ListItem\",\"position\":2,\"name\":\"Welcome\",\"item\":\"https://docs.bioptimus.com/documentation/introduction\"}]},{\"@type\":[\"Article\",\"TechArticle\"],\"@id\":\"https://docs.bioptimus.com/documentation/introduction#article\",\"headline\":\"Welcome\",\"name\":\"Welcome\",\"description\":\"Deploy and build with foundation models for biology — across histology, transcriptomics, and genomics.\",\"url\":\"https://docs.bioptimus.com/documentation/introduction\",\"mainEntityOfPage\":{\"@id\":\"https://docs.bioptimus.com/documentation/introduction#webpage\"},\"dateModified\":\"2026-09-21T11:34:02.536Z\",\"publisher\":{\"@id\":\"https://docs.bioptimus.com/#organization\"},\"isPartOf\":{\"@id\":\"https://docs.bioptimus.com#website\"}}]}\u003c/script>\u003cscript data-mint-head type=\"application/ld+json\">{\"@context\":\"https://schema.org\",\"@type\":\"WebSite\",\"name\":\"Bioptimus Documentation\",\"creator\":{\"@type\":\"Organization\",\"name\":\"Mintlify\",\"url\":\"https://mintlify.com\"}}\u003c/script>","siteName":"Bioptimus Documentation","nav":{"global":{"anchors":[{"anchor":"GitHub","icon":"github","href":"https://github.com/bioptimus"},{"anchor":"Knowledge Base","icon":"book-open","href":"https://www.bioptimus.com/knowledge-base"}]},"tabs":[{"tab":"Overview","groups":[{"group":"Get Started","pages":[{"title":"Welcome","href":"/documentation/introduction"},{"title":"Quickstart","description":"Pick your model and platform, then run your first inference.","href":"/documentation/quickstart"}]},{"group":"Models","pages":[{"title":"H-Optimus","href":"/documentation/models/h-optimus"},{"title":"M-Optimus","href":"/documentation/models/m-optimus"},{"title":"Tissue segmentation","href":"/documentation/models/tissue-segmentation"},{"title":"Benchmarks","href":"/documentation/models/benchmarks"}]},{"group":"Use Cases","pages":[{"title":"Drug target \u0026 biomarker discovery","href":"/documentation/use-cases/biomarker-discovery"},{"title":"Indication expansion","href":"/documentation/use-cases/indication-expansion"},{"title":"Diagnostics \u0026 spatial biology","href":"/documentation/use-cases/diagnostics-spatial-biology"},{"title":"Treatment response \u0026 trial design","href":"/documentation/use-cases/treatment-response"}]},{"group":"Resources","pages":[{"title":"FAQ","href":"/documentation/resources/faq"},{"title":"Glossary","href":"/documentation/resources/glossary"},{"title":"Responsible use","href":"/documentation/resources/responsible-use"},{"title":"Security \u0026 compliance","hidden":true,"href":"/documentation/resources/security-compliance"},{"title":"License","href":"/license"}]}]},{"tab":"Deployment","pages":[{"title":"Deployment","href":"/deployment/overview"}]},{"tab":"Bioptimus SDK","pages":[{"title":"Bioptimus SDK","href":"/guides/get-started/sdk"}]},{"tab":"Bioptimus Inference Server","pages":[{"title":"Bioptimus Inference Server","href":"/api-reference/introduction"}]}]},"title":"Welcome - Bioptimus Documentation","buildId":"dpl_5UGCeHaPhSKbAExsKaHeR8dW3HyG","deploymentId":"dpl_5UGCeHaPhSKbAExsKaHeR8dW3HyG","dynamics":["07c022d89b","a74be98ba7","a9bb46feb3"],"chunks":["Frame-DYrD4gCJ.js","DynamicMarkdown-BTVnG8lc.js","zoom-image-lightbox-DgtuyVql.js","PlusIcon-BCNs_Q8j.js","lightbox-handle-r17bVUz3.js","Markdown-C49Ap2gN.js","dist-Bg8TUsFc.js","lib-B6V4jynN.js","lib-vtHBCq3V.js","clsx-BAOLXcPh.js","html-void-elements-mCSPHezU.js","katex-Cnv50rb0.js","marked.esm-BKo0Hl1x.js","AssistantPageLink-SGAqkgdw.js"]}